")
The Global Academic View (GAV) framework for developing the market outlook is as follows:
- Evaluate the current economic data with the key drivers.
- Evaluate the market-based expectations for longer-term inflation.
- Evaluate the expected US monetary policy (consistent with inflation expectations).
- Evaluate the recession probability (based on the monetary policy expectations).
- Evaluate the credit risk (to confirm an imminent recession expectations)
- Develop the expectations for future economic data.
- Develop the stock market outlook based on expected data (also for commodities, USD, and interest rates).
Executive Summary
3/26/2022
- Economic data still strong, based on recent unemployment claims.
- Inflation expectations high and still rising, no supply/demand improvements – de-globalization long term driver.
- Fed now expected to hike even more aggressively in 2022.
- Recession probability rising – 10y-5y inverted.
- Financial markets are pricing the effects of higher interest rates (SP500 laggards), and rising inflation (commodities), with stronger USD, and weaker global growth.
- Key events and expectations:
- Data to start reflecting slower growth with elevated inflation (stagflation).
- Fed to actually hike aggressively by 50bpt at the next meeting.
- Stock market outlook: bear market to continue
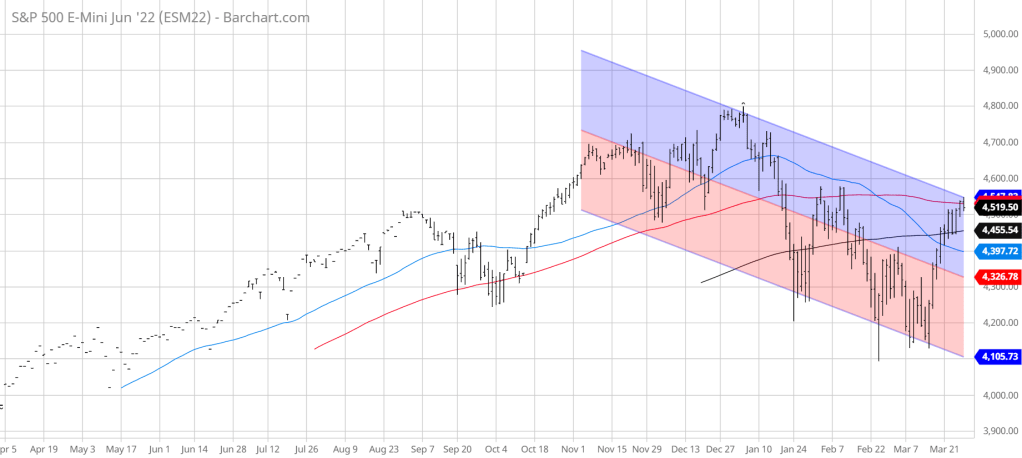
- Counter trend risk: 100dma technical breakout could cause the trend following rally.
Current Data
| GDP = 5.6% yoy | Strong post-pandemic growth boosted with extraordinary monetary and fiscal stimulus. GDPnow q1= 0.9% slowdown from 1.3% (decrease in domestic investment) |
| Unem.rate = 3.8% | Full employment – claims strong: no slowdown |
| CPI: 7.1% | Well above the 2% target – triggered the Fed’s price stability mandate. |
Inflation drivers: demand still strong – supply sill tight (China COVID lockdowns, Russia sanctions)
| Demand shock: | Supply shock: |
| Extraordinary pandemic-related monetary stimulus causing higher credit consumption. Extraordinary pandemic-related fiscal stimulus (direct cash, benefits).Investment gains: stock market, housing, cryptocurrencies.Pandemic-related labor shortage causing rising wages (around 5%). | Pandemic related labor shortage (low participation rate)Pandemic related supply chain bottlenecks (China 0-covid policy)Pandemic related material shortages (chips)Commodity shortages: Russia sanctions, geopolitics (long-term problem?)Longer term: de-globalization |
Expected long term inflation: Rising. But real rates rising faster (end of QE beginning of QT expected).
| 5-Year Breakevens = 3.70% 10-Year Breakevens= 2.99% 30-Year Breakevens= 2.56% | Long inflation expectations seem to be de-anchoring. 5-Year Breakevens are above the key 3% level, and 10Y Breakevens are above the key 2.75% level. De-globalization is likely to contribute to rising inflation long term. |
| 2.49%=-50%+2.99% | US10-Ger10=1.91% – widening, USD positive. |
Expected monetary policy (the Fed) Hike faster in 2022 – Fed more behind, first cut Dec 24.
Inflation-mandate: monetary tightening. QE ended in March and QT to be announced in May. Possible easing starts in January 2025 – recession?
| Current | Jan 2023 | Sep 2023 | Dec 2024(June 2024) | Jan 2025 |
| 0.34% | 2.41%(2.01%) | 2.95%(2.57%) | 2.65% | 2.65%(2.12%) |
Note: Out of 13 interest rate hikes since 1945, a recession occurred 10 times. Exceptions: 1994-95, 1983-84, 1965-66
Recession probability: very high – rising – caused by the Fed
| 10Y-2Y | 0.20% | Flattening (steady at 0.2) |
| 10Y-5Y | -0.08% | Inverted – recession forthcoming |
| 2Y-3mo | 1.75% | No immediate recession expected – Fed more behind |
Increase in Federal Funds rate leads to inverted yield curve, which precedes a recession. 10y-2y is the best indicator: did not invert in 1995 and 1984 (no data for 1966).
Credit risk: rising– falling- intervention? No expectations of an imminent credit crunch or a recession.
| 10Y-BBB | 2.01%(2.17%) | Decreased from 2.38% on March 10 – as S&P bounced (1.77% on Jan 19th |
Spikes in a recession as defaults increase.
Expected data: slowing growth with high inflation – stagflation (eventually recession)
| Slowing growth (slowing demand – the Fed) | Higher interest rates (Fed) – less credit consumption – lower sales (discretionary sector) Higher mortgage rates (10y) – lower housing prices (wealth effect – housing stocks) Lower stock market and cryptocurrencies – wealth effect (less consumption) Russia sanctions and higher oil – lower consumption (as long as sanctions last) (energy) Longer-term: de-globalization leads to slower growth (less exports and imports) |
| Uptick in Unemployment | Slower growth will lead to uptick in unemployment rate (lower demand) |
| High Inflation to persist | Higher oil (Russia) will keep inflation high (oil as well as other commodities) Longer-term de-globalization is inflationary. Pandemic related supply-chain bottlenecks still inflationary (China lockdowns). Supply issues unresolved – demand still not affected by the Fed and Oil |
Financial markets scan: Market pricing is consistent with the recessionary expectations in the US, caused by higher inflation and the Fed. The only sectors going up are energy and other commodities, which is also consistent with higher inflation and late cycle.
| YTD (last w) | Last move | Leaders | Laggards* | Next move | |
| SP500 | -4.68% (-6.75) | Bounce from 13% drawdown to 100dma Bear market rally? | XLE: 41% XLU: 1.68% XLF: 1.20% | XLC: -10.94% XLY: -10.31% XLRE: -9% XLK: -9% | Consistent with inflationary recession – slow growth high inf. |
*Needs lower interest to boost laggards – unlikely to happen.
| YTD (last week) | Last move | Pricing | |
| EEM | -7.68% (-6.75) | Bounce from sell-off | China regulation. Reacts neg. as Fed rises interest rates. |
| EAFE | -6.89% | Bounce from sell-off | Global recession. Bounce as oil corrected. |
| GSCI | 25% (22%) | Correction | Inflation – sanctions on Russia, supply chains, demand |
| USD | 3.85% (2.86) | Uptrend pause | Slower global growth, Fed more aggressive, Euro (Russia) |
| Gold | 6% | Correction | Rising real rates-? Geopolitics FTS+? Strong USD-? |
Market outlook
| S&P500 | Down | US recession expected – no global or domestic counter positive drivers. |
| EEM | Down | US recession, protectionism, de-globalization |
| STOXX | Down | Negatively affected by the Russian sanctions and the war |
| Euro | Down | The Fed more aggressive, EU growth relatively weaker |
| AUD | Neutral | Higher commodity prices positive – weak global growth (de-globalization) negative |
| Comm | Up | Russia sanctions play: oil, palladium, platinum, wheat Risk: recession and demand destruction Broadly: Up leading to a recession – down with an imminent recession |
| Gold | Neutral | Rising real rates and stronger USD are negative vs flight to safety (geopolitics and recession) and de-dollarization are positive |
| 10Y fut | Neutral | Flight to safety (geopolitics and recession) vs rising inflation exp and rising real rates |
Risk variables: what could change? (decrease in inflation expectations and widening of the yield curve)
- Quick end of Ukraine war and removal of Russian sanctions – oil goes down and the Fed is less aggressive. Unlikely – long conflict expected.
- China embraces US against Russia, and China tariffs are reduced – rebirth of globalization. Unlikely – China is under US tariffs and constant threat, plus the issue of Taiwan.
- End of covid and increase in global demand – global reopening, with easing supply chains. End of covid likely, but global reopening will be overshadowed by the de-globalization (inflation).
Turning point trades: At which point do you start pricing an imminent recession (interest rate cut, lower commodities, weaker USD?
Chart of the week: S&P 500 at the 100dma resistance after the bear market rally.